Dashboards (Screens)
Build full-screen dashboards from gauges, buttons, maps and more, with as many pages as you like.
On the home screen, tap Screens to open your dashboard: full screen, glanceable, and arranged however you like. The screen stays awake while it's open. Swipe left and right between pages.
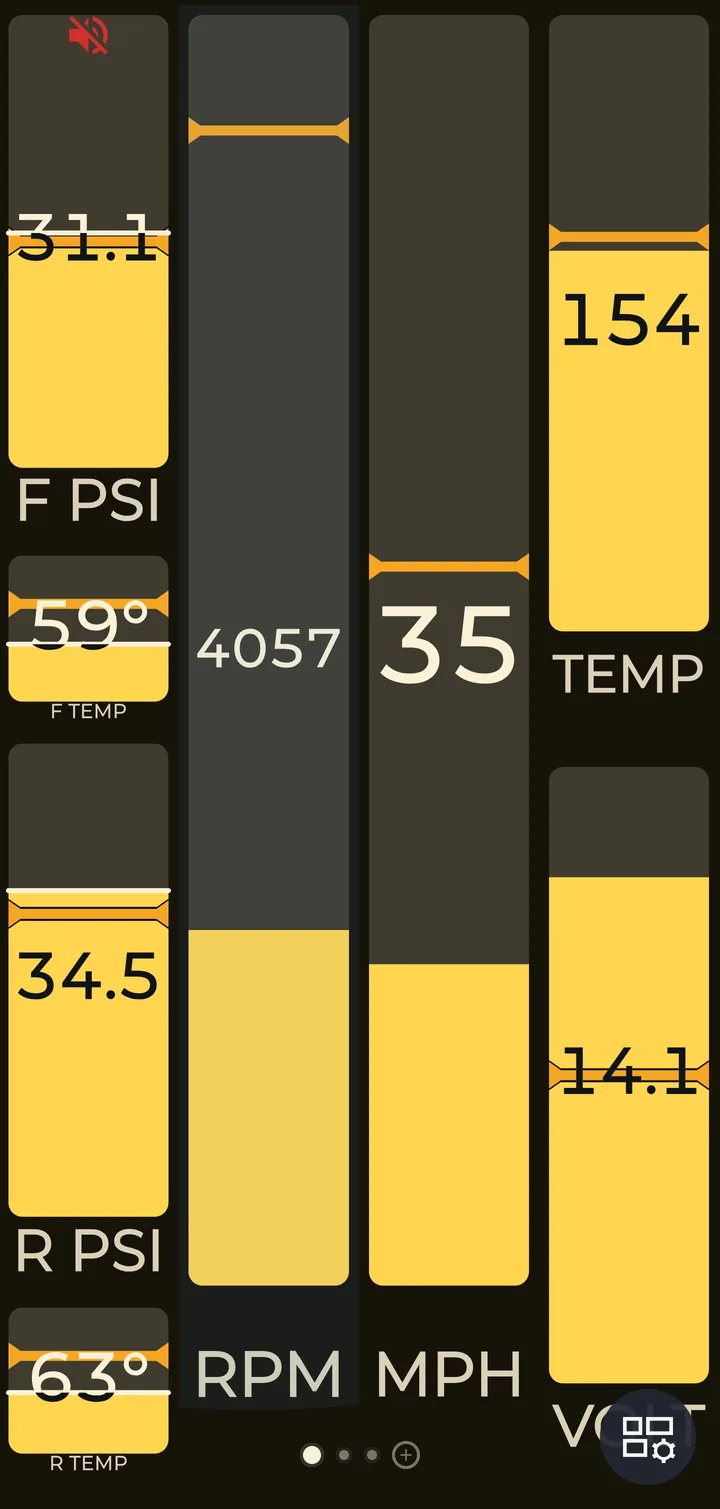
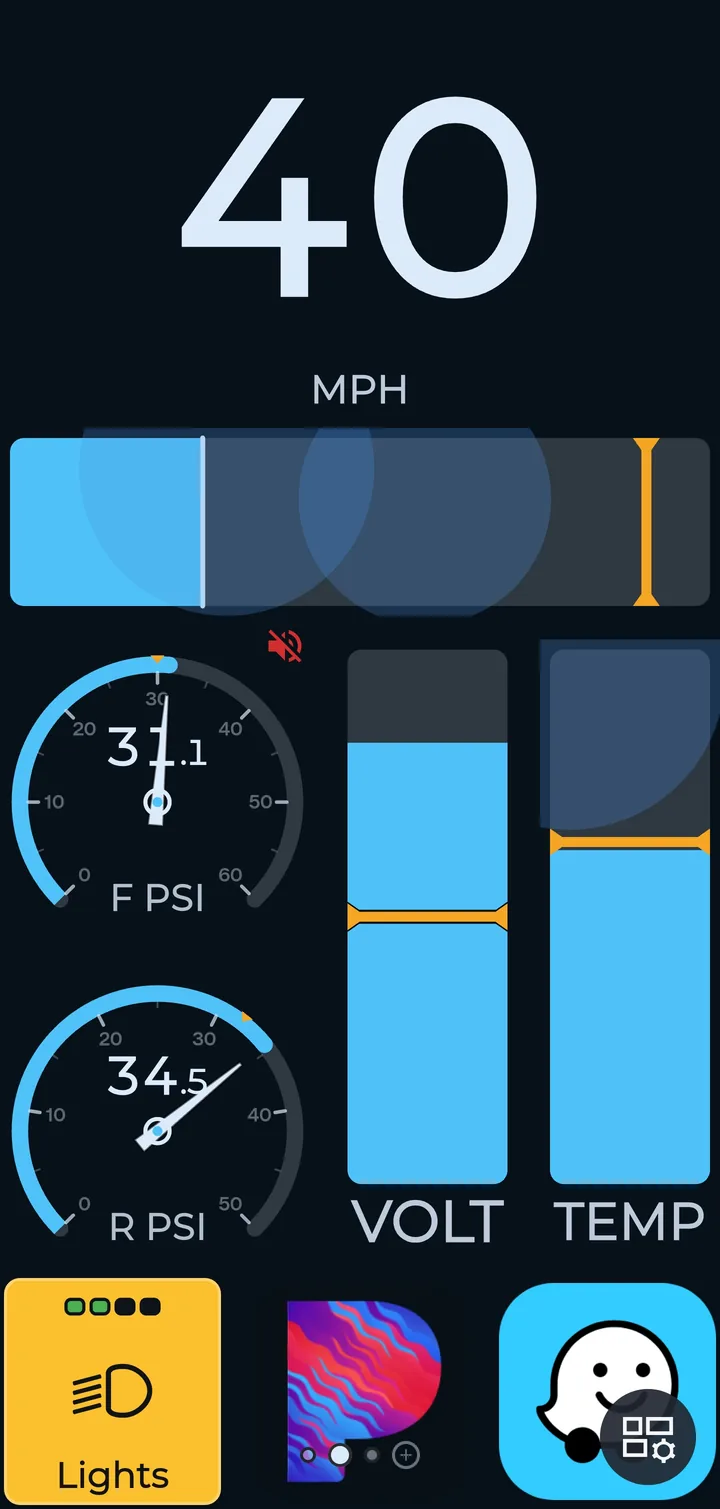
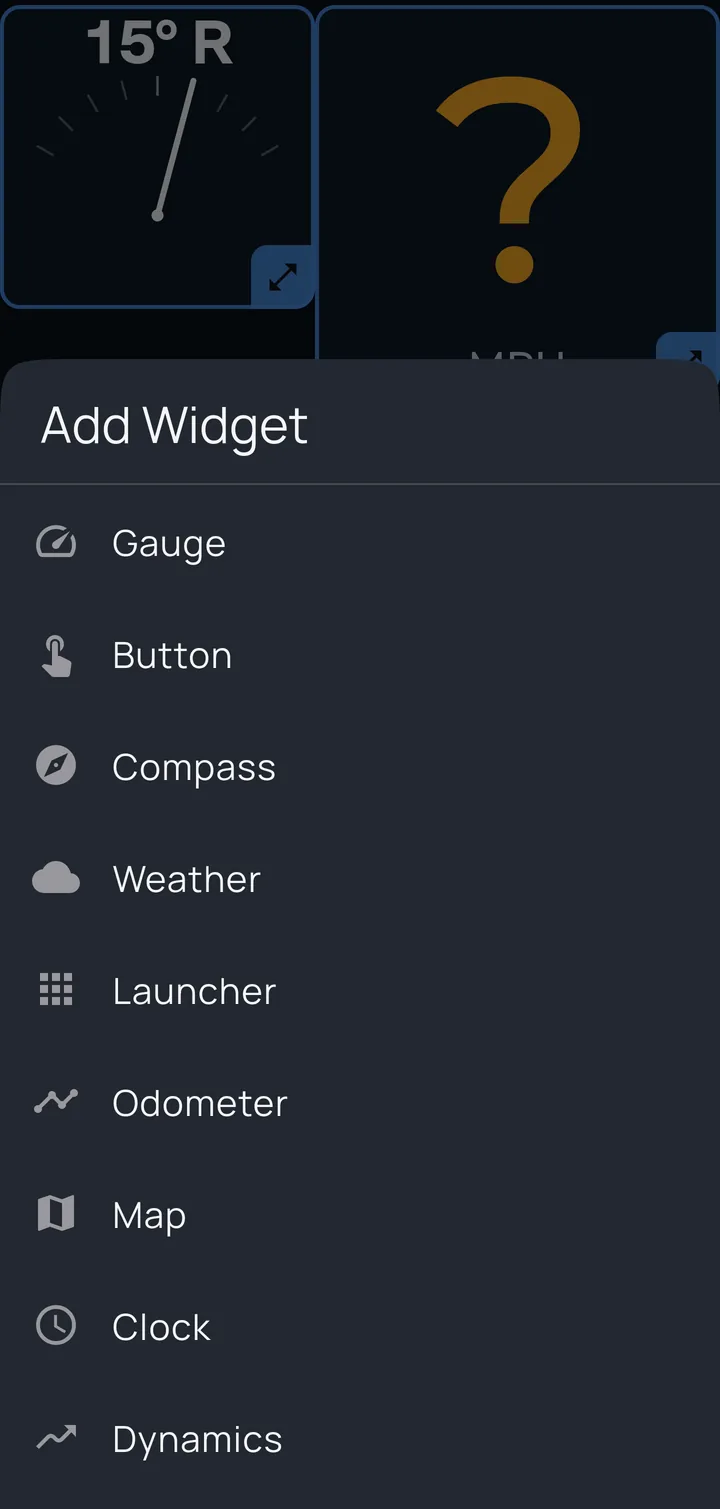
Widgets
- Gauge: any reading Kivo has (OBD2 values, CAN signals, tire pressure and temperature, GPS speed, lean and G-force) in several styles: numeric, dial, horizontal or vertical bar, full-cell bar. Bars can fill solid or in segments, change color past the alarm point, show the alarm point on the scale, and hold their peak. Needles and bars glide smoothly between readings.
- Button: lights, volume, mute, recording, ride markers and more (see Actions and outputs).
- Map: your position on a street map, north-up or track-up, with optional zoom by speed.
- Compass: a heading tape with bearings to your waypoints.
- Odometer: lifetime distance and two trip meters (each can count always, or only while connected to the vehicle). Long-press a trip meter to reset it.
- Clock: the time of day, or how long the current ride has been recording.
- Dynamics: a friction circle showing lean angle and G-force from the phone's motion sensors. Mount the phone, then accelerate or brake in a straight line until the G-meter appears. Long-press to recalibrate.
- Weather: current conditions, refreshed every 15 minutes.
- Launcher: one-tap shortcuts to your navigation or music apps.
Gauges show what an alarm watches
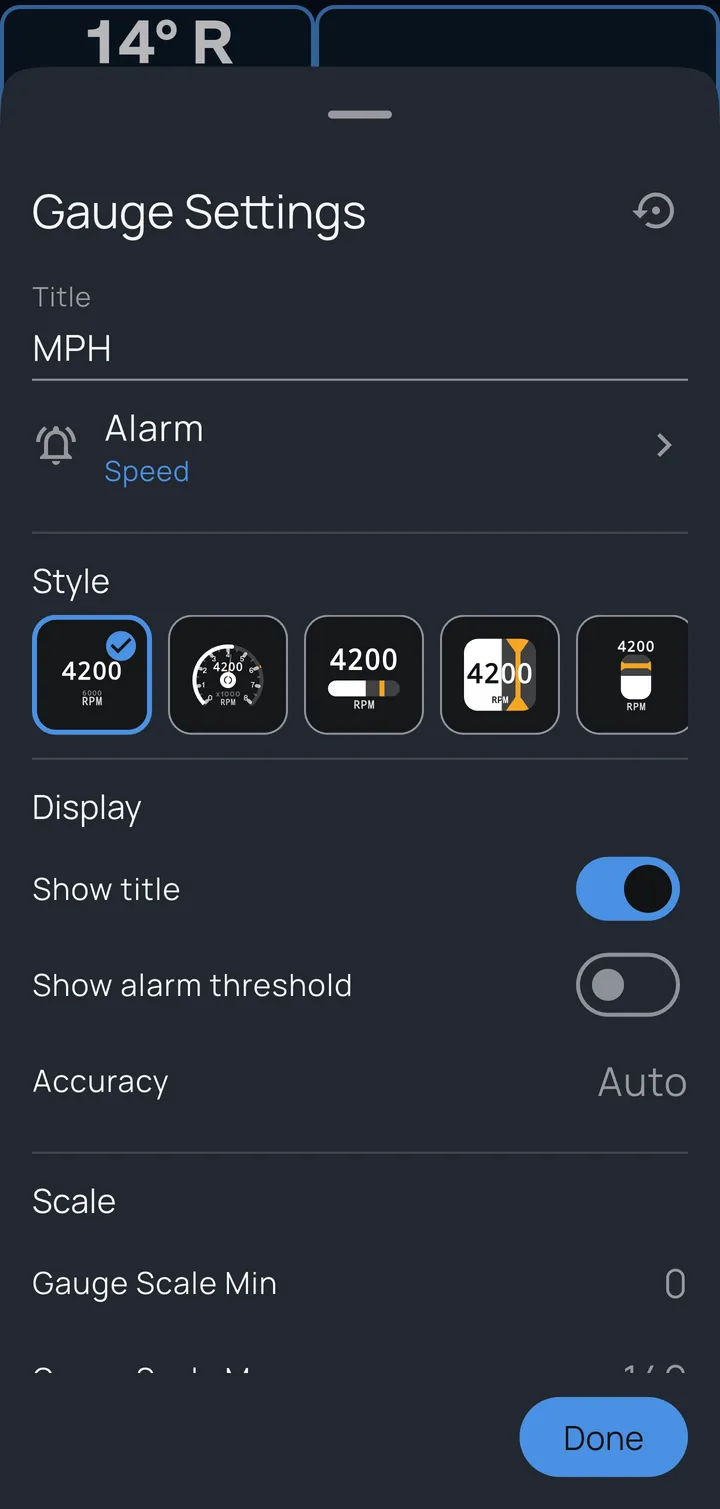
A gauge displays the reading one of your alarms watches, and can mark that alarm's threshold on its scale. So when you add a gauge, Kivo first asks you to choose an alarm. To show a new reading, add an alarm for it first (it can be switched off if you only want the gauge).
Editing a dashboard
Tap the round dashboard button in the bottom-right corner (it hides after a few seconds; tap the screen to bring it back). The page switches to editing: every widget gets an outline and a resize handle, and a toolbar appears.
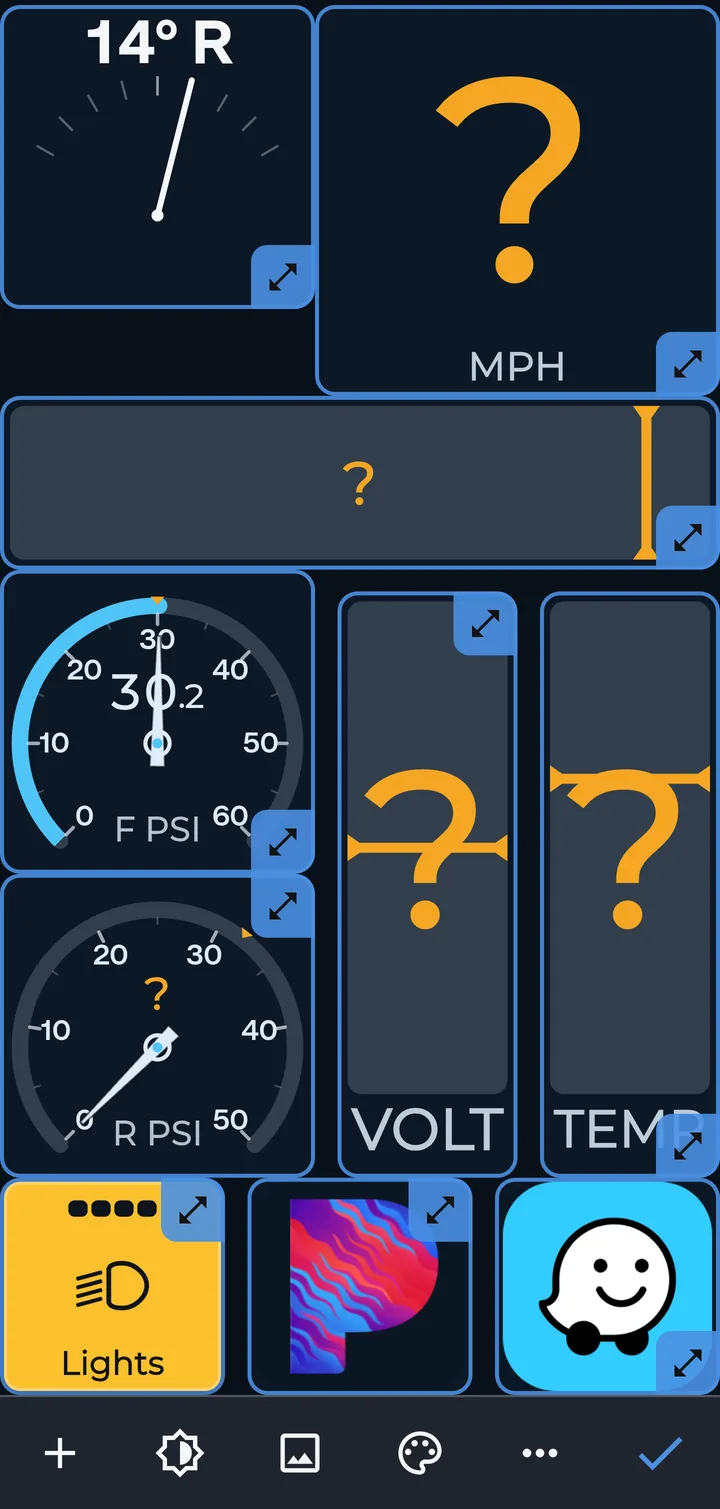
- Tap a widget to set it up: what it shows, its style, colors and scale.
- Long-press and drag to move it; other widgets slide out of the way. Drag the corner handle to resize.
- To delete a widget, drag it onto the ✓ Done button, which turns into a bin while you're carrying something.
- The toolbar, left to right: Add a widget, Day/Night look, Background image, Color, More (font, rotate the page, delete the page) and Done. Long-press a toolbar button to see its name.
Editing works on one page at a time, and finishes by itself after a minute without changes.
Pages
A profile can have several dashboard pages. The last dot under the page is a +: swipe to that blank page and add widgets to start a new one. Each page is designed in one orientation (portrait or landscape), and the screen locks to it while that page is showing. Pages can have their own background, font, colors and day/night look, so a night page can look completely different from a day page.
The alert banner
When an alarm with Warn fires, its message appears in a banner across the middle of the dashboard, whichever page you're on. With several alerts active, the banner cycles through them, with a pause each cycle so you can still see the gauges.